

Connect the dots. Collect the value.
Data visualization by Agilytic

Advanced analytics and "big data" are creating unprecedented opportunities for businesses to achieve deeper, faster insights that can strengthen decision-making, boost commercial performance, improve the customer experience, and revolutionize HR processes.
Today, however, many big data projects struggle to yield either meaning or value. Organizations are so submerged by the volume and variety of data flowing into and through their operations that they struggle to store the data — let alone analyze, interpret, and present it in meaningful ways.

It's, therefore, no surprise that businesses are increasingly turning to visualization-based tools that promote self-service business intelligence, enabling diverse stakeholders to easily integrate or "mash-up" data from a wide range of sources: sales, social media, production, invoicing, and more.
The trend toward visualization-based data discovery tools is worth exploring by any organization that seeks to draw tangible results from big data. The potential business benefits are immense.
As demonstrated by a sales-driven case study, visualization-based tools are already delivering improved decision-making capabilities to organizations willing to make the transition.
Demonstrated expertise with leading data visualization solutions

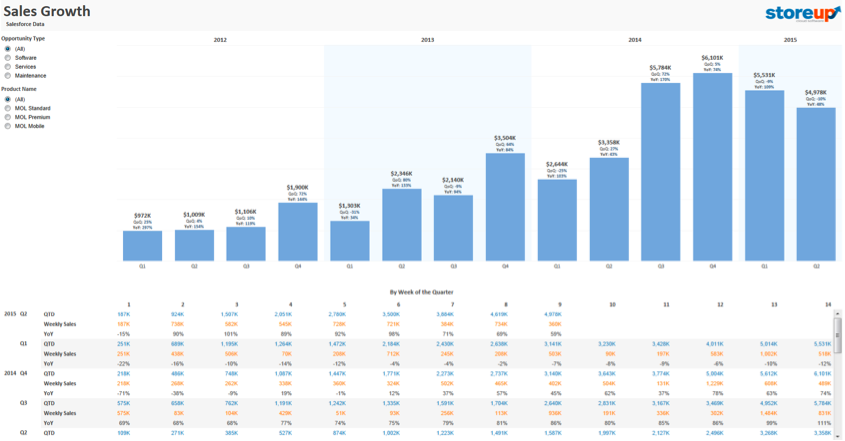
Case study: boost your sales with dynamic dashboards.
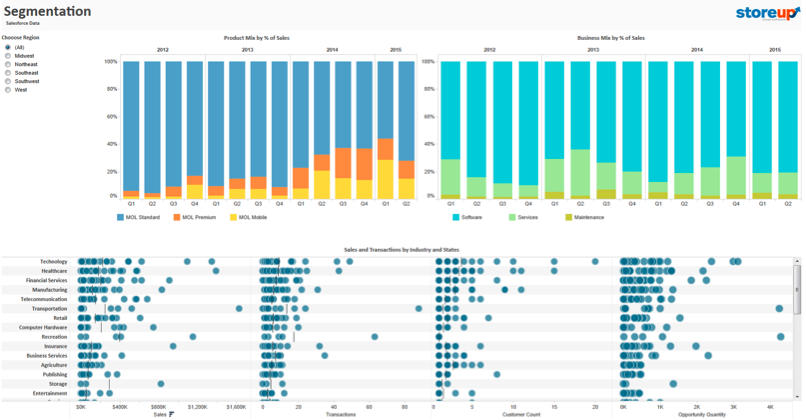
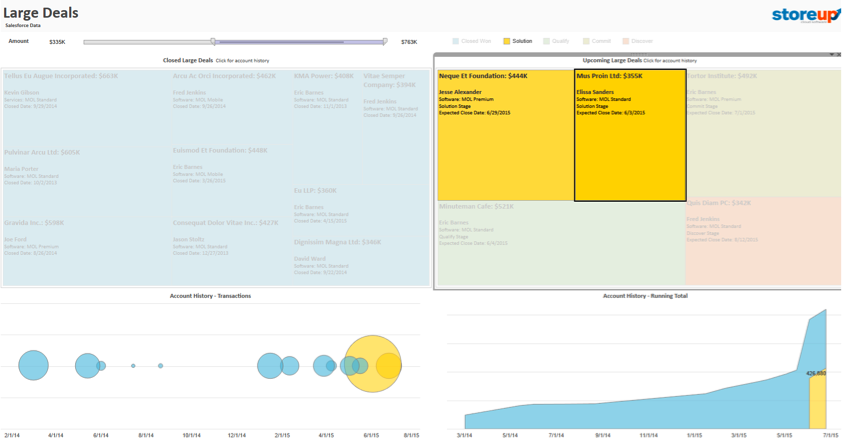
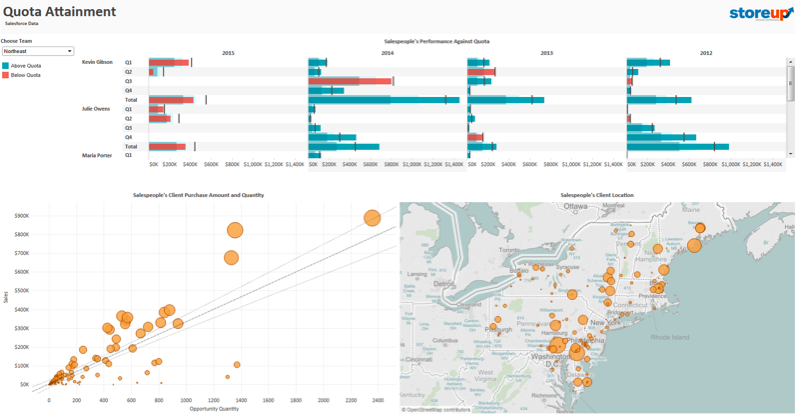
Every organization needs to make decisions about sales data. As a modern organization, you should stay on the hunt for the best way to look at sales information. Here are five ways to look at your sales operations to help make decisions about quota, territory management, and must-win deals.

Fictional case for illustrative purposes only. Example courtesy of Tableau software.

Train your team in data visualization
and storytelling
We love to share what we learn. Our certified data scientists are happy to provide hands-on training in data visualization, from the preparation phase to the storytelling structure of effective dashboards.
Learn more about Agilytic trainings.
Get a tailored estimate that fits your needs.