
Tech Talk: How to use predictive analytics for cross-selling campaigns
In a saturated B2B industry, cross-selling is an interesting approach to increase revenue at a lower cost. If a customer has already bought your products, selling another product to this customer is generally less expensive than convincing a new buyer.
Most companies have relied on internal marketing expertise to decide who to contact in a cross-selling campaign. Another approach is to use machine learning methods to make decisions backed by data to determine what customer to contact and which product to offer.
In this article, we will focus on constructing a machine learning model for cross-selling. This model will predict whether a customer will purchase another product from the company within a defined time horizon. The goal is to identify the characteristics of customers who buy this product and then recommend it to similar customers.
Understanding and transforming data for modeling
First, we extract useful data from the source systems. We then transform it and make it available for modeling. These steps are called Extract-Transform-Load (ETL), which we’ve written about previously.
What are we classifying exactly? Defining a precise target
In parallel to the ETL, we must clarify the definition of the target with the marketing department. The target is what we will predict. In our case, we defined the target as the customer’s product purchase in the few months following a specified date. In this future period, we look at whether the customer buys is called the prediction window.
What information are we relying on? Talking with stakeholders
We analyze customers’ behavior over a certain period of time in the past to define their future behavior. We call this period in the past the observation window. For example, knowing a customer spent 1000 euros 5 years ago may not be relevant to our current problem. The same customer spending 500 euros on another product two months ago is probably more suitable.

Can we predict whether customers will buy a product in the next 6 months based on their behavior over the past 12 months?
We create indicators that describe the customer’s buying behavior. For instance, we can study buying behavior based on the observation window. Thus, we calculate the amount spent per product, the number of interactions with the sales team, the number of exchanges with the after-sales service, the number of commercial emails opened, etc. To compute these indicators, we slice the relevant data from the source system then aggregate them in different ways by summing, taking the average, or taking ratios. We generally refer to this part as feature engineering.
Encoding categorical variables
Since we must train the classification model with numerical data, we encode categorical data, i.e., converted into numerical values interpretable by the model. The most famous encoding method is to create one binary variable per category. We refer to this as one-hot encoding. This method is easy to implement and usually works well. However, when the variable to be encoded has a large cardinality, creating a binary variable per category will significantly increase the dimensionality of the dataset. This may result in not having enough training observations to predict the target. For instance, if a categorical variable has 250 unique values, encoding this variable will create 250 binary variables.
To encode these variables with a large cardinality, the target encoding is the solution. For each category, we calculate the probability of the target. Then, we replace the category with its probability. We then obtain a single column containing probabilities. This method works well for variables such as zip or NACE codes.
Class imbalance
For some of the products, very few customers were using them. In our training data, the two classes were then completely unbalanced - 5% of the population was in the class that would buy the product soon, and the other 95% would not. These proportions are problematic because the models may indiscriminately classify all observations in the majority class. We then resort to oversampling or subsampling techniques to rectify the balance between the classes, from 5%-95% to 20%-70%.
In other words, we artificially create new observations of the minority class (oversampling) or remove observations of the majority class. Generally, we perform both procedures in parallel to reach equilibrium. In the case of this study, we performed a combination of oversampling with SMOTE and random subsampling.
Measuring model performance in a marketing context
Once you train prediction models, you want to evaluate how useful they are. You also want to have a performance metric that will mean something to those who will use it, e.g., the marketing team. In this context, quality metrics are generally the Lift at some point or the cumulative (lift) gain at some threshold. The advantage of these metrics is their direct interpretability.
These metrics compare the model performance with a selection at random, answering the question ‘how much better is my model than chance?’. Let’s say we want to launch a cross-selling campaign, and we want to get a list of customers to contact.
There are several ways to create this list. We can rely on chance, on the expertise of our team, on a predictive model. For each method, we ask for list sorting from the customers that are more likely to buy to the ones that are less likely. If we decide only to contact the first 10% of the list, we will get customers the marketing team or the predictive model are the most confident about. In the case of the predictive model, the model will translate that into higher prediction scores.
An example of cross-selling model performance
If we have 20% of our customers interested in buying the product, we will want to find them as quickly as possible without having to contact 100% of our database. That is precisely where the cumulative lift is interesting. It gives us the proportion of clients to contact to find a certain proportion of buyers.
If we take the graph below, on the x-axis, we have the percentage of customers reached by the campaign. Obviously, we first start to contact clients for which we are more confident they will buy, those with higher prediction scores. On the y-axis, we have the percentage of actual buyers who were contacted. There are several lines on the graph, one by the method used to create the list.

The cumulative lift for a cross-selling problem comparing random selection, expertise, and predictive model
Using a random selection of customers will find buyers linearly, meaning if you contact 20% of the clients, you will have found 20% of the buyers. This is the baseline performance that we want to exceed. If we rely on a list of marketing experts (turquoise line), by contacting the first 20% of customers, we will find around 40% of all buyers, twice more than random selection. By contacting the 20% of customers recommended by the predictive model (pink/red line), we will find 60% of all buyers.
This is a convenient way to describe the model performance and put it in perspective.
Using prediction scores to drive your commercial strategy
We can use the same graphs to derive the contact strategy. We could already convince the first clients with higher prediction scores. So, it may not be necessary to spend money to contact them as they will buy the product anyway. On the other end of the spectrum, clients in the last 10% are mostly not interested in the product. Contacting these clients might then result in wasted money.
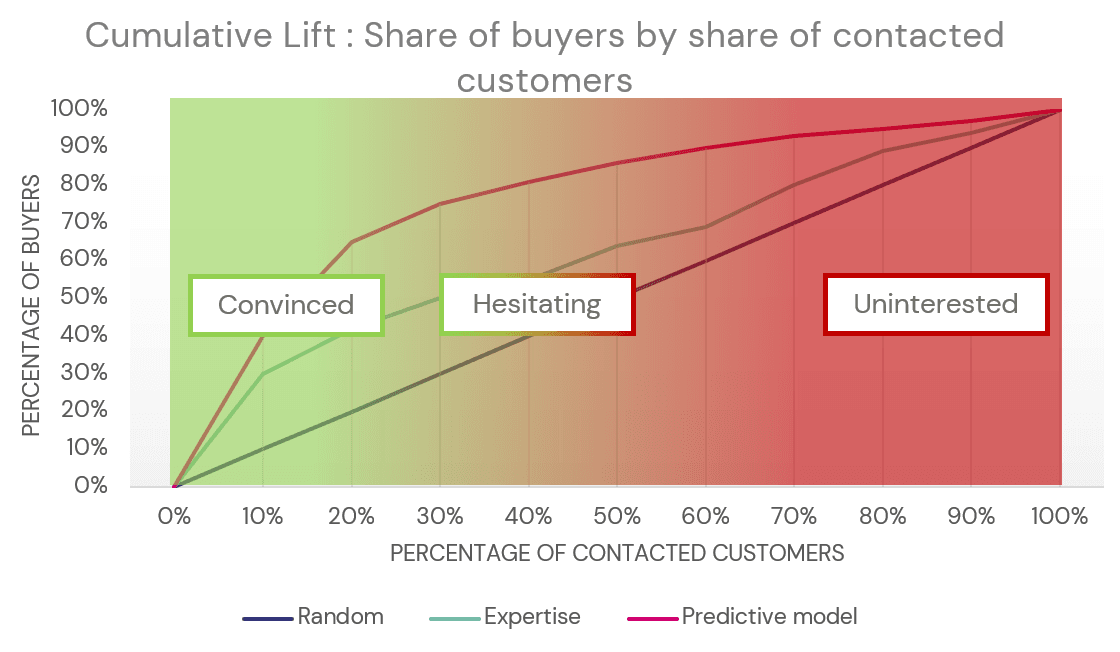
Deriving interest for the product by quantile
This is where the cumulative lift curve may drive the commercial strategy. The graph above attributes the different quantiles of customers to segments of those that are already convinced (high prediction scores), the hesitating ones (medium to high prediction scores), and the uninterested ones (low prediction scores).
From these segments, we could derive a strategy:
Either securing the convinced ones
Or turning the hesitating clients into convinced clients
The takeaways
In this Tech Talk, we reviewed different tips to help you create a predictive model for cross-selling and build a commercial strategy around your model outputs efficiently. We addressed the following points:
The importance of precisely defining the target with the marketing team,
Building your training data based on an observation window,
Carefully encoding your categorical variables,
Adapt your training data for imbalanced classification,
Using the cumulative lift to explain your model performance,
Using the cumulative lift to derive the commercial strategy.